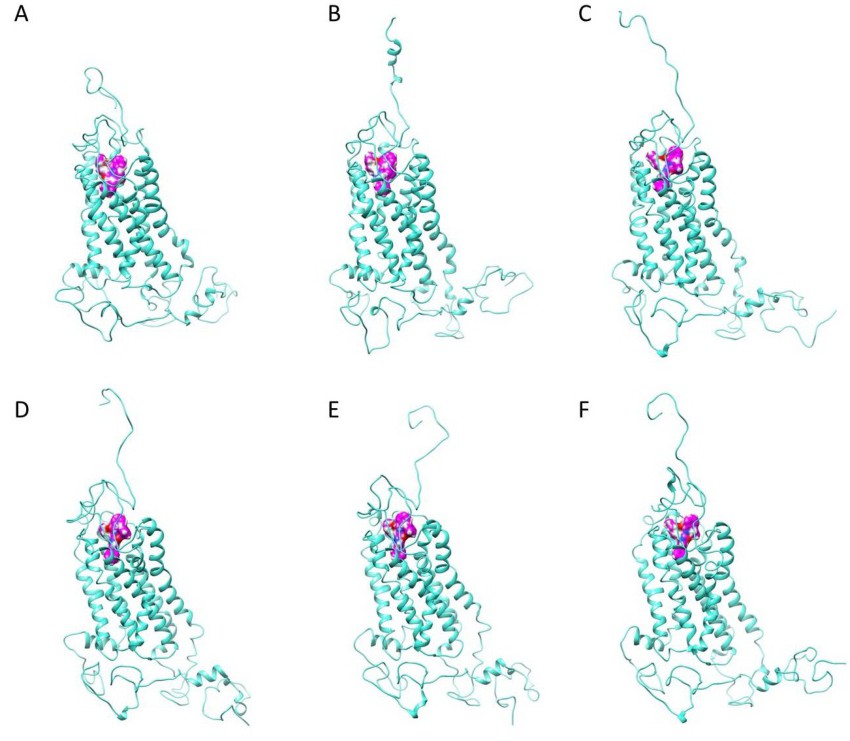
Fig. 9. Molecular dynamic simulations snapshots during the 100 ns study of GnIHR2-RF313 complex. Snapshot A is taken at 0 ns, B at 20 ns, C at 40 ns, D at 60 ns, E at 80 ns, and F at 100 ns. GnIHR2 has been represented in ribbon structure, whereas RF313 is represented in space filling model in purple color.